


Advertisement

snowBrain
snowBrain
snowBrain allows you to visualize the total revenue for each product category using a bar chart. It provides a Python script that uses the pandas and seaborn libraries to generate the plot.
Main Features:
Bar visualization of total turnover for each product category
Uses Pandas and Seaborn libraries for data manipulation and plotting
snowBrain allows users to visualize total revenue for each product category via a bar chart. By running a provided Python script, which uses the pandas and seaborn libraries, users can generate the chart with product categories on the x-axis and total revenue on the y-axis. The plot can be customized with labels and titles, and requires the Seaborn and Pandas libraries to be installed.
Vote :




Alternatives to this tool
Connect Google Sheets to OpenAI API (Script) is software that provides an easier way to connect Google Sheets to OpenAI API without the need for[...]
Excelly-AI is a powerful tool that allows users to easily transform plain text into Excel formulas in their browser. With Excelly-AI, users no longer need[...]
AskExcel is an AI-powered data analysis tool that allows users to ask questions, generate reports, and find insights. Main Features: Automatically generated reports and graphs[...]
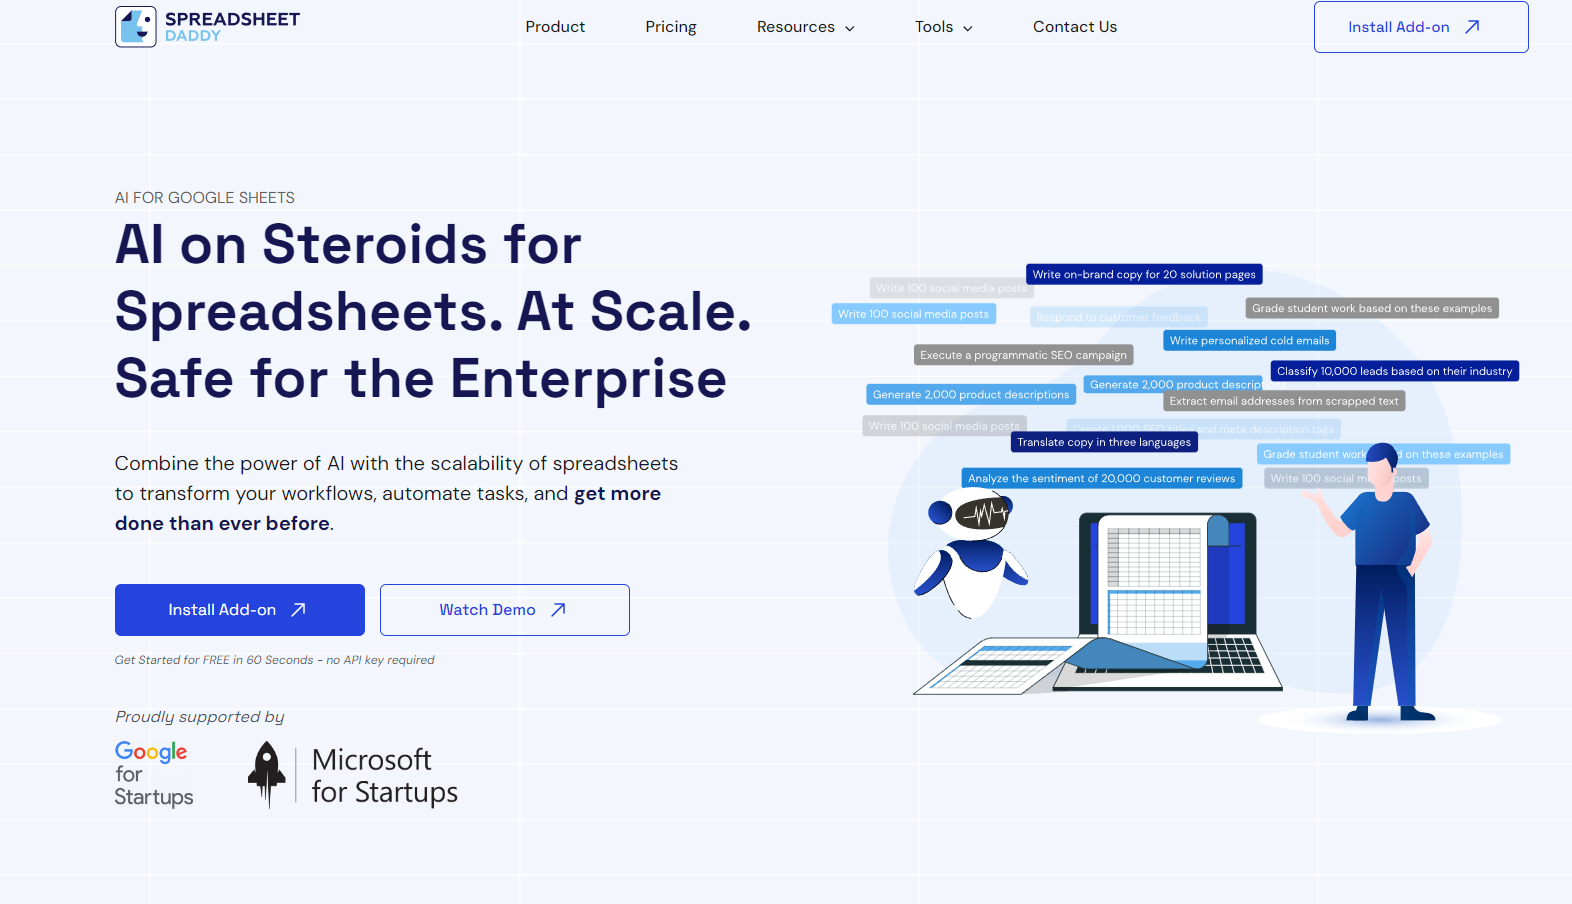
Spreadsheet Daddy is an innovative AI-powered add-on designed specifically for Google Sheets. It seamlessly integrates the power of AI into the familiar, scalable environment of[...]
Excel Formula Bot is a website that uses natural language processing algorithms to generate Excel or Google Sheets formulas based on simple text prompts.
Highcharts GPT is a powerful tool that leverages ChatGPT's natural language processing capabilities to create reliable and secure data visualizations in seconds. Main Features: Intuitive[...]
Many is an AI tool that offers a range of features to improve your productivity. It can generate content, analyze customer reviews, translate text, extract[...]
